

As is not uncommon in early winter, regional weather conditions have been working to erode the blanket of snow laid down by the January 4-5-6 winter storm.
This item is available in full to subscribers.
To continue reading, you will need to either log in to your subscriber account, or purchase a new subscription.
If you are a current print subscriber, you can set up a free website account and connect your subscription to it by clicking here.
If you are a digital subscriber with an active, online-only subscription then you already have an account here. Just reset your password if you've not yet logged in to your account on this new site.
Otherwise, click here to view your options for subscribing.
Please log in to continue |
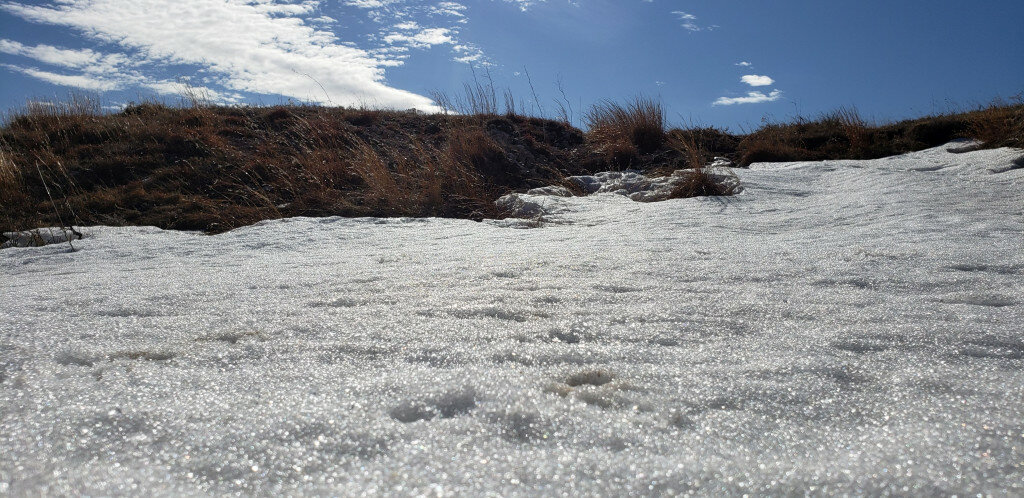
KIMBALL – As is not uncommon in early winter, regional weather conditions have been working to erode the blanket of snow laid down by the January 4-5-6 winter storm.
Sunshine, warming air temperatures, and breezy conditions managed to melt quite a bit of snow cover across the region and a good bit of snow melt managed to get into thirsty soil.
Regional forecast and conditions
As of Tuesday morning (January 18), the temperature at sunrise was 36 degrees under mostly clear skies. Winds were westerly at 13 gusting 18 mph and the barometer was slowly rising at 29.79 inches of mercury (in/Hg).
Today’s weather (Friday, January 21) is expected to be mostly cloudy with a 40 percent chance of snow and breezy. The daytime high air temperature should reach about 37 degrees before falling off to an overnight low of 14 degrees. Skies are expected to be partly cloudy and breezy. Day length will be 9 hours and 42 minutes, night length 13 hours and 18 minutes.
Saturday should be sunny and breezy with a high near 37 degrees. Saturday is expected to be partly cloudy and blustery with a low temperature of 19 degrees.
Sunday is expected to be clear, breezy, and slightly warmer with a high near 45 degrees before falling off to an overnight low of 23 degrees.
Conditions Monday-Wednesday are expected to be sunny, breezy, and cool with daytime highs in the low 30’s and overnight lows falling into the lower teens. No precipitation is forecast through mid-week.
At Kimball the January 11-17 daytime high averaged 41 degrees, about 8 degrees warmer than last week. The weekly high temperature was 48 degrees on January 17. Overnight lows averaged 20.14 degrees, about 13.14 degrees warmer than last week. The weekly low temperature was 6 degrees on January 14. The weekly mean temperature at Kimball was 30.57 degrees, about 10.57 degrees warmer than last week and 3.77 degrees warmer than the January average of 26.8 degrees. The long-term average high and low temperatures at Kimball for January 40.3 and 13.4, respectively.
Kimball received no precipitation over the January 11-17 period.
Winds near Kimball averaged west-northwesterly and sometimes brisk over the January 11-17 period. Gusts for the week averaged 29.57 mph. High gusts for the week was 45 mph on January 14.
Here’s an overview of January 21 temperature and precipitation highs, lows, and averages over the preceding 129 years at Kimball. Data is taken from the High Plains Regional Climate Center (www.hprcc.unl.edu), where you can find and track data for your own particular location.
Last year (January 21, 2021): Daily high temperature 42 degrees, overnight low 25 degrees, average temperature 33.5 degrees. Precipitation zero inches, snowfall zero inches, snow depth zero inches.
The warmest January 21 on record was 71 degrees in 2005. The coolest January 21 high temperature was 4 degrees in 1962. The coldest January 21 overnight low was -24 degrees in 1930. The warmest January 21 overnight low was 39 degrees in 1950. Over the years since 1893 the high temperature on January 21 has averaged 40.3 degrees, the overnight low 12.9 degrees, the daily average 26.6 degrees, precipitation has averaged 0.01 inches, snowfall 0.1 inches, snow depth zero inches.
The highest January 21 precipitation total was 0.25 inches (3 inches snow) liquid equivalent in 1905, while the highest snow depth was 8.0 inches in 1949 (following the Blizzard of ‘49).
USDA weekly weather and crop bulletin, January 18
This report was delayed due to Monday’s federal holiday.
U.S. drought monitor
USDM reports derive normals/averages from the most recent 30-year period, though longer timescale data are used where available. The USDM generally reports on current drought conditions and offers a comprehensive history of drought across the Continental U.S. Near-term temperature and precipitation predictions derive from National Weather Service (NWS) and National Oceanic and Atmospheric Administration (NOAA) forecasts.
Current drought status for the Nebraska Panhandle, Southwest Wyoming, and Northeast Colorado. Drought Categories: D0 -- abnormally dry. D1 -- moderate drought. D2 -- severe drought. D3 -- extreme drought. D4 -- exceptional drought.
(January 11, 2022) Heavy precipitation pelted the northern half of the West Coast again this week. Farther east, 2 to 3 inches were common across the Idaho Panhandle and the higher elevations farther south and east, including western Wyoming and north-central Colorado. Heavy precipitation also pelted the southern Ohio Valley and the lower Mississippi Valley on a swath south of the Ohio River, central and northeastern Arkansas, and part of easternmost Texas. Moderate precipitation fell on parts of the Pacific Northwest, the northern Intermountain West, and the central and northern Rockies adjacent to areas with higher amounts. Similar totals also fell on parts of the Great Lakes Region, and in the East from the Ohio River to the Atlantic and Gulf of Mexico coasts. Light to locally moderate precipitation dampened most of the Carolinas, Virginia, the interior Northeast, and portions of the central and northern Great Plains. Elsewhere, little if any precipitation fell, including an area from Oklahoma and Texas westward across much of Nevada and southern California. Looking at the 48 states as a whole, there was considerably more improvement than deterioration, except for Texas, which saw areas of deterioration across the state.
High Plains: Substantial precipitation (over 0.5 inch) was generally restricted to higher-elevation areas in Wyoming and Colorado. Farther east in the Plains States, only the northern and southern portions of the region recorded more than 0.2 inch. Some deterioration was introduced in southern Kansas where temperatures were the highest, but other areas from the Dakotas southward remained unchanged. Heavy precipitation has been common across the higher elevations of central and northern Colorado in the past couple of months. Some of these mountains received several inches more than normal precipitation in the last 90 days, resulting in abundant snowpack that prompted drought improvement through this region. Other areas were unchanged.
West: Another week of heavy precipitation affected the Pacific Northwest from the Cascades to the Pacific Coast. Lesser but still above-normal amounts pelted central Washington and north-central Oregon. The valleys east of the Cascades recorded at least 0.5 inch while much of the northern Intermountain West – including most of Idaho and western Montana – reported just under an inch to nearly 3 inches in spots. Farther south, areas near the coast as far south as northern California received multiple inches of precipitation including the northern Sierra Nevada. Moderate precipitation also fell on parts of northern Utah. From the Great Basin and central California southward through the southern Rockies – including the southern half of the Four Corners States – most areas received no precipitation. Based on the abundant precipitation and ample snowpack observed so far this winter, improvement was brought into several areas.
Near-term forecast: With the exception of the East and Southeast, most of the 48-states will only see light precipitation at best. Most of the country west of the Appalachians should end up at least somewhat milder than normal for the period, especially from the Great Basin through the northern High Plains and Rockies, where temperatures are expected to average 8 to 16 degrees F above normal. Noticeably subnormal temperatures should be restricted to the Northeast, possibly reaching as far south as the Carolinas.
The Climate Prediction Center’s outlook through the coming weekend favors above-normal precipitation across northern portions of the Rockies and Plains, across most of New England, and in the South from the Big Ben of Texas to the Atlantic Coast as far north as southern Virginia. In contrast, odds slightly favor below-normal precipitation in a swath from the central Ohio Valley westward into the south-central Plains. Better odds for drier than normal conditions cover much of the Four Corners States, the Great Basin, and much of the West Coast. Areas from the West Coast through the southern half of the Plains and the lower Mississippi Valley have enhanced chances for above-normal temperatures, but odds favor cooler than normal weather in the northern Plains, Great Lakes Region, Northeast, and Middle Atlantic States.
Terminology: EDDI -- Evaporative Demand Drought Index. This is an experimental model for drought prediction, using nationwide data from 1980-present. SPE -- Standardized Precipitation index, correlating present month/year precipitation with 30-plus year historical data. SPEI -- Standardized Precipitation Evapotranspiration Index. SWE -- Snow Water Equivalent.
For more information on the U.S. Drought Monitor, including an explanation of terminology, visit: http://droughtmonitor.unl.edu.


