

Arctic air flowed down from Canada along an atmospheric pressure gradient as 2022 arrived,
This item is available in full to subscribers.
To continue reading, you will need to either log in to your subscriber account, or purchase a new subscription.
If you are a current print subscriber, you can set up a free website account and connect your subscription to it by clicking here.
If you are a digital subscriber with an active, online-only subscription then you already have an account here. Just reset your password if you've not yet logged in to your account on this new site.
Otherwise, click here to view your options for subscribing.
Please log in to continue |
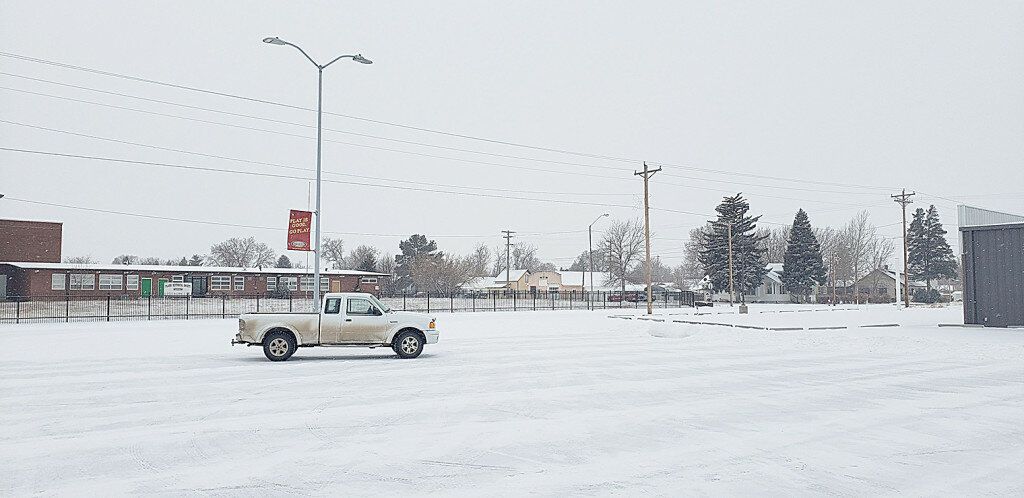
KIMBALL – Arctic air flowed down from Canada along an atmospheric pressure gradient as 2022 arrived, bringing sharply colder air temperatures and delivering welcome snowfall across a good portion of the northern High Plains.
Over the week encompassing the New Year, light to moderate snow dusted the region, followed by clear skies and windy conditions. Temperatures generally warmed following the New Year’s snowfall, but forecasts were calling for a winter storm on Wednesday, January 5, predicting heavy snowfall, brisk winds, and temperatures plunging to minus 10 degrees overnight. Five to seven inches of new snow were expected at Kimball.
Regional forecast and conditions
As of Tuesday morning (January 4), the temperature at sunrise was 37 degrees under clear skies. Winds were westerly at 27, gusting 35 mph and the barometer was steady at 29.68 inches of mercury (in/Hg).
Today’s weather (Friday, January 7) is expected to be partly sunny with a daytime high air temperature of 46 degrees. Skies will be partly cloudy and conditions blustery overnight with temperatures dropping to about 22 degrees. Day length will be 9 hours and 21 minutes, night length 13 hours and 39 minutes.
Saturday is expected to be mostly sunny and breezy with a high of 45 degrees. Saturday night is forecast to be partly cloudy and colder with a low temperature of 10 degrees.
Sunday should be sunny with a high of 36, while Sunday night should be clear with a low of 12 degrees.
Conditions Monday-Wednesday are expected to be seasonably mild with mostly clear skies; daytime highs should range in the mid-40’s to low-50’s with overnight lows falling into the low teens. No precipitation is forecast through mid-week.
At Kimball the December 28-January 3 daytime high averaged 26.85 degrees, 25.57 degrees cooler than last week. The weekly high temperature was 48 degrees on December 30. Overnight lows averaged 8.57 degrees, about 13.57 degrees cooler than last week. The weekly low temperature was -9 degrees on January 1. The weekly mean temperature at Kimball was 19.71 degrees, about 17.57 degrees cooler than last week and 8.69 degrees cooler than the December average of 28.4 degrees. The long term average high and low temperatures at Kimball for December are 41.7 and 15.0, respectively, and for January 40.3 and 13.4, respectively.
Kimball received 1.3 inches of snow on New Year’s Eve and 0.10 inches of snow on New Year’s Day. Liquid equivalent precipitation from this event totalled 0.20 inches.
Here’s an overview of January 7 temperature and precipitation highs, lows, and averages over the preceding 128 years at Kimball. Data is taken from the High Plains Regional Climate Center (www.hprcc.unl.edu), where you can find and track data for your own particular location.
Last year (January 7, 2021): Daily high temperature 44 degrees, overnight low 16 degrees, average temperature 30.0 degrees. Precipitation zero inches, snowfall zero inches, snow depth zero inches.
The warmest January 7 on record was 65 degrees in 2006. The coolest January 7 high temperature was -3 degrees in 1937. The coldest January 7 overnight low was -19 degrees in 2017. The warmest January 7 overnight low was 38 degrees in 1948. Over the years since 1893, the high temperature on January 7 has averaged 40.2 degrees, the overnight low 12.8 degrees, the daily average 26.5 degrees, precipitation has averaged 0.01 inches, snowfall 0.1 inches, snow depth zero inches.
The highest January 7 precipitation total was 0.20 inches (4 inches snow) liquid equivalent in 1944, while the highest snow depth was 13.0 inches in 1949.
USDA weekly weather and crop bulletin, January 4
This report was unavailable at press time due to a severe winter storm in the Washington, D.C. area.
U.S. drought monitor
USDM reports derive normals/averages from the most recent 30 year period, though longer timescale data are used where available. The USDM generally reports on current drought conditions and offers a comprehensive history of drought across the Continental U.S. Nearterm temperature and precipitation predictions derive from National Weather Service (NWS) and National Oceanic and Atmospheric Administration (NOAA) forecasts.
Current drought status for the Nebraska Panhandle, Southwest Wyoming, and Northeast Colorado. Drought Categories: D0 – abnormally dry. D1 – moderate drought. D2 – severe drought. D3 – extreme drought. D4 – exceptional drought.
(December 28, 2021) A persistent pattern over the North Pacific and western North America maintained a continuation of frequent storms affecting the West Coast through late December. 7-day precipitation from December 21-27 exceeded 2 inches, liquid equivalent, across much of California along with western portions of Oregon and Washington. During the past two weeks, precipitation has averaged 150 to 300 percent of normal, or more, throughout nearly all of California. This wet pattern during mid to late December has also been accompanied by below normal temperatures across California and the Pacific Northwest. Periods of heavy snow continue to build a favorable snowpack from the Cascades southward to the Sierra Nevada Mountains. On December 23 and 24, a strong low pressure system tracked inland from the East Pacific and resulted in widespread precipitation of 0.5 to 3 inches, liquid equivalent, across much of southern California along with the Great Basin, Southwest, and Four Corners region. Dry weather with much above normal temperatures persisted throughout the central and southern Great Plains. As of December 28, month-to-date temperatures have averaged more than 7 degrees F above normal across the south-central U.S. Eastern North Dakota and the upper Mississippi Valley received another round of precipitation (0.25 to 0.75 inches, liquid equivalent) this past week.
High Plains: A continued expansion of abnormal dryness (D0), moderate drought (D1), and severe drought (D2) were required again this week across much of Kansas due to worsening soil moisture indicators, 90 to 120-day SPIs, declining streamflows, and impacts such as cattle sell-offs. A 1-category degradation was made to the southwest corner of Nebraska based on soil moisture and SPI values at various time scales. A recent increase in snowpack led to improving drought conditions across the central Rockies, to the west of the Continental Divide. Severe (D2) to extreme (drought) was expanded across northeast Colorado due to declining soil moisture indicators and EDDI. Precipitation (more than 0.5 inch, liquid equivalent) on Dec 26 along with positive SPI values dating back 6 months supported a slight decrease in abnormal dryness (D0) and moderate drought (D1) across central and eastern North Dakota.
West: Heavy December precipitation, SWE numbers, and 12 to 24-month SPIs supported a large 1-category improvement to California along with parts of Nevada and Utah. The SWE is 150 to 250 percent of normal throughout the Sierras for this time of year. As of December 28, the California statewide average of snow water content is 159 percent of normal for that date. Given the favorable snowpack and heavy precipitation during December, additional improvements may be warranted for California during subsequent weeks.
Widespread, heavy precipitation (1 to 3 inches, liquid equivalent) resulted in a 1-category improvement across parts of Arizona and Utah where the heaviest amounts occurred and also supported by 12-month SPI values. A 1-category improvement was also made to much of northern and central Idaho along with adjacent areas of northwest Montana based on near to above normal SWE and 24-month SPI. A sharp gradient in drought conditions exists from west to east along the Continental Divide.
During the past 14 days, parts of southeast Washington and northeast Oregon have received more than 2 inches of precipitation, liquid equivalent. This recent heavy precipitation and favorable response from soil moisture and 28-day streamflow indicators prompted a slight improvement to those areas. The longer term SPEI, which includes the record heat earlier this summer, continues to support extreme (D3) to exceptional (D4) drought for central and eastern parts of Oregon and Washington. Along and to the west of the Cascades, additional improvements were made this week to western Oregon. A recent increase in snowfall prompted improving drought conditions across parts of northern New Mexico, while all of northeast New Mexico is now designated with severe (D2) to extreme (D3) drought. No precipitation has been observed at Clayton, New Mexico for 76 days which is the 5th longest streak on record.
Near-term forecast: A low pressure system and trailing front are expected to progress eastward from the central to eastern U.S. from Jan 1 to 2. A swath of snow may occur on the northwest side of the surface low track, from the central Plains northeast to the Midwest and Great Lakes. Little to no precipitation is expected for the southern Great Plains into the beginning of the New Year. Following a brief moderation in temperatures, another outbreak of Arctic air is anticipated to shift south from Canada into the northern Plains during the first week of January 2022.
The Climate Prediction Center’s 6-10 day outlook favors above-normal temperatures across the southern Great Plains. Below-normal temperatures are very likely for the northern Great Plains. Near or below-normal temperatures are favored throughout the West. Above-normal precipitation is most likely across the northern to central Rockies, Great Basin, Pacific
Northwest and northern California. Below-normal precipitation remains favored for the southern Great Plains.
Terminology: EDDI – Evaporative Demand Drought Index. This is an experimental model for drought prediction, using nationwide data from 1980-present. SPE – Standardized Precipitation index, correlating present month/year precipitation with 30-plus year historical data. SPEI – Standardized Precipitation Evapotranspiration Index. SWE – Snow Water Equivalent.
For more information on the U.S. Drought Monitor, including an explanation of terminology, visit: http://droughtmonitor.unl.edu.


